Frequently Asked Questions
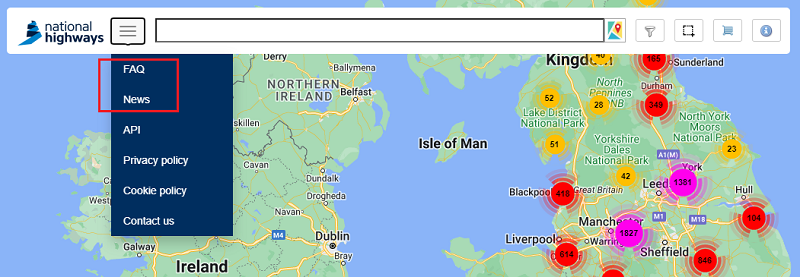
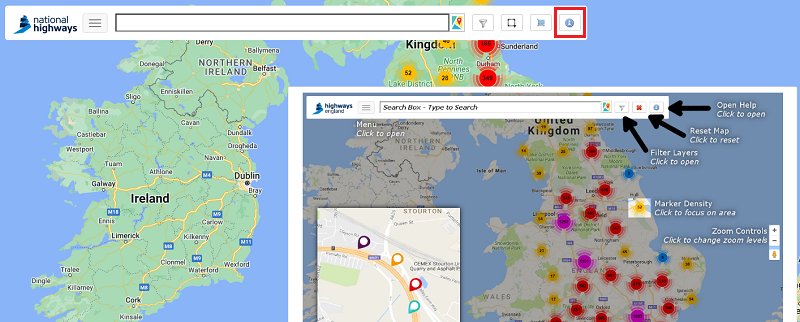
1. Where can I get help?
The help section, FAQ and Contact Us pages will all be in the menu drop down as illustrated:
2. Site Markers and what they mean
Currently, National Highways directly monitor the speed and flow of roads using on road sensors which fall into three categories.
 MIDAS sites (Motorway Incident Detection and Automatic Signalling) which are predominantly inductive loops (though there are a few sites where radar technology is being trialled)
 Inactive MIDAS sites
 TMU sites (Traffic Monitoring Units) which are inductive loops
 Inactive TMU sites
 TAME sites (Traffic Appraisal, Modelling and Economics) which are inductive loops
 Inactive TAME sites
 TRADS Legacy sites
 Inactive TRADS Legacy sites
Regardless of the site type they all count traffic in a similar fashion.
3. Which browsers will WebTRIS work with?
Latest version of Internet Explorer
Latest version of Google Chrome
Latest version of Firefox
4. Can I Bulk/Batch Download data?
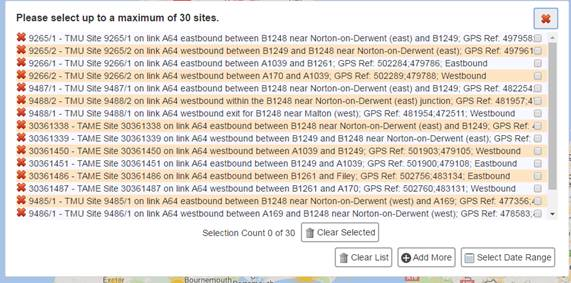
Data can be bulk downloaded using the batch reporting functionality as illustrated:

After selecting this option, you can collect a maximum of 30 sites within the grid draw tool on the map interface. Adding these sites to your ‘basket’

Sites can then be added or removed from your ‘check out’ screen before executing the report.
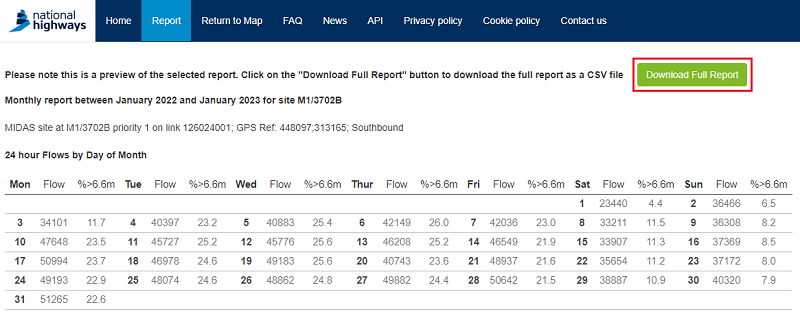
5. All requested data is not showing on the report screen
All data will be available in the downloaded report rather than the on-screen report, you will need to download the report to view.
6. Marker density key
 = 1-9
= 1-9 = 10 -99
 = 100 - 999
 = 1000 - 9999
 = 10000+
7. Data Quality Calculations and colour scheme
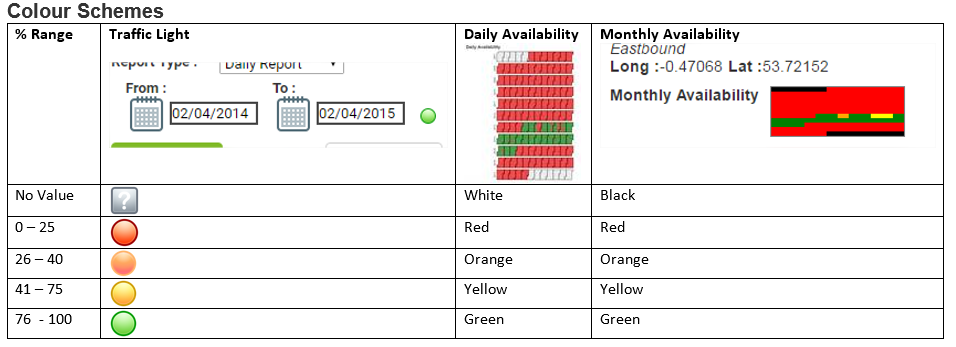
Data Quality Calculation
The calculation for the Data Quality is as follows:
(Sum the total number of minutes’ worth of data) / (Total number of days in the selected date range * 1440) * 100 to give a percentage. This calculation is the same for all reports.
8. Data update schedule
Data from the sensors on the network are usually processed and uploaded to the WebTRIS service a month in arrears.